How to Choose Solar Power for Home in 2026?
Choosing solar power for home in 2026 is no longer a simple question of roof space. It requires a practical review of sunlight, electricity tariffs, battery needs, equipment quality, and local installation standards. The International Energy Agency’s Renewables 2024 report expects renewable capacity to expand by nearly 5,500 gigawatts between 2024 and 2030. Solar photovoltaics are expected to provide most of that growth. As IEA Executive Director Fatih Birol stated, “Solar PV and wind are the new kings of global electricity markets.”
The household decision is more personal. A south-facing roof may produce strong output, while morning shade can quietly reduce annual generation. NREL’s Annual Technology Baseline shows that solar costs and performance vary by system design, location, financing, and maintenance assumptions. Battery storage can improve evening resilience, but it also adds capital cost, replacement questions, and installation complexity. A cheaper quote is not always better.
Look beyond the glossy proposal. Check the installer’s experience, workmanship warranty, inverter coverage, monitoring platform, and expected degradation rate. Compare annual savings under realistic utility prices, not perfect sunshine. Review the payback period carefully. It may change.
This guide examines solar power for home through an evidence-based lens. It considers roof inspections, panel technology, batteries, incentives, safety, and long-term ownership. The analysis will reference IEA, NREL, and other established industry data. Still, no report can predict every household’s future tariff or storm exposure. That uncertainty matters. A reliable choice balances measurable returns with comfort, resilience, and honest limits.
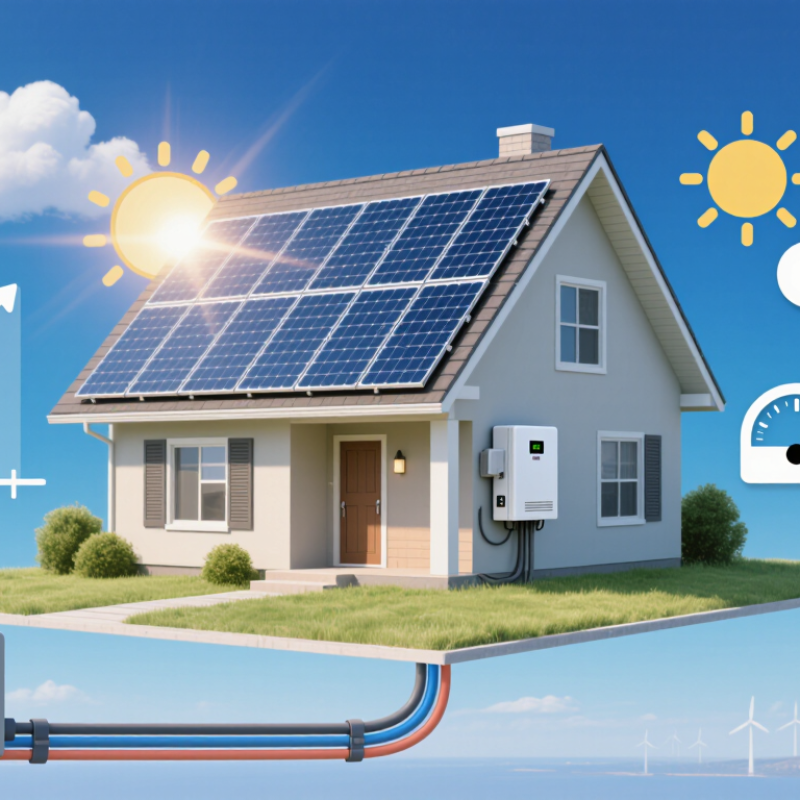
Assess Home Solar Potential: PV Output Varies by Location and Roof Orientation
How to Choose Solar Power for Home in 2026?
Choosing solar power in 2026 starts with your roof, not a brochure. PV output changes with sunlight, temperature, shade, and local weather. A home in southern Spain may produce far more than one in northern England. Yet annual sunshine alone can mislead. Cloud patterns and winter darkness matter too. Location matters. Your electricity bills show when energy is used. That timing affects system value.
Stand outside at different times. Watch shadows from chimneys, trees, and nearby buildings. A roof facing south often receives strong exposure in the northern hemisphere, while east and west roofs can still perform well. Roof pitch also matters. A shallow roof may need careful mounting, especially where snow or heavy rain occurs. In the southern hemisphere, the preferred direction usually changes. Shadows move. Local solar maps provide useful estimates, but they are not a site visit.
During a home assessment, record roof dimensions, compass direction, pitch, and seasonal shading. Ask a qualified installer to check roof age, wiring, structural strength, and local permitting requirements. Request production estimates based on weather data, not perfect-sky assumptions. I once treated a small afternoon shadow as harmless. Across a year, it reduced expected output more than I anticipated. Models can be wrong. Leave room for uncertainty, battery losses, maintenance, and future tree growth. Compare projected kilowatt-hours with your actual annual consumption. A larger system is not automatically a better fit.
Calculate Electricity Needs Using the U.S. Average of 886 kWh per Month
How to Choose Solar Power for Home in 2026?
The U.S. residential electricity average is about 886 kWh per month, according to the U.S. Energy Information Administration. That equals roughly 10,632 kWh annually. Use this figure as a starting point, not a promise. Your home may consume more during winter heating or summer cooling.
A practical solar estimate begins with local sunlight. NREL’s PVWatts research tool accounts for solar radiation, system losses, orientation, and weather. In many sunny locations, a 1-kilowatt system can produce about 100 to 150 kWh monthly. Meeting 886 kWh could therefore require roughly 6 to 9 kilowatts of solar capacity. A 400-watt panel would mean approximately 15 to 23 panels. Roof shade can change the result quickly. So can snow.
Tips:
Review twelve months of utility bills before choosing equipment.
Separate daytime and nighttime consumption. Check the roof’s age, direction, slope, and shaded areas. Leave a modest production buffer, perhaps 10% to 20%, for seasonal variation. The U.S. Department of Energy notes that efficiency upgrades can reduce the system size needed. Sealing air leaks or improving insulation may help first.
These calculations remain imperfect. I would avoid sizing from one unusually low bill. Future electric vehicles, heat pumps, or household changes can raise demand. A qualified installer should verify the design with site measurements and current local data.
Compare Panel Efficiency: Leading Modules Exceed 23% Under STC Ratings
Choosing solar power in 2026 starts with panel efficiency, especially when roof space is limited. Some leading modules now exceed 23% under Standard Test Conditions (STC). STC means 1,000 watts of sunlight per square meter, a cell temperature of 25°C, and a defined air mass. These figures create a fair laboratory comparison. They do not describe every afternoon on your roof. A 23% module can produce more electricity from the same area than a 20% module. That difference matters on narrow roofs, shaded extensions, or homes with high daytime demand. Small gains count.
Do not judge efficiency alone. Check the temperature coefficient, because hot cells usually lose output. Review low-light response, annual degradation, and measured power tolerance. A clear datasheet should list testing standards and warranty terms. Ask an accredited installer to model your roof using local sun hours, tilt, direction, and shading from chimneys or trees. A 450-watt panel may fit poorly if its dimensions create unused gaps. Roof layout can defeat headline efficiency.
Higher efficiency often costs more per panel. Compare total installed cost, not just the module price. Inspect inverter sizing, mounting hardware, cable routes, and maintenance access. I would question unusually perfect production estimates. Weather is messy. Dust, heat, snow, and partial shade can reduce output. My judgment may change after reviewing twelve months of utility data. That is not a weakness; it is a better decision process. Choose the module that delivers strong lifetime energy on your roof, with evidence you can verify.
How to Choose Solar Power for Home in 2026?
Compare panel efficiency: leading modules exceed 23% under STC ratings
| Panel Technology |
Typical Module Efficiency |
Typical Power Rating |
Temperature Coefficient |
Typical First-Year Degradation |
Typical Annual Degradation After Year 1 |
Best Fit for a Home |
Key Consideration |
| Conventional Monocrystalline Silicon |
19%–22% |
350–460 W |
Approximately −0.35% to −0.40%/°C |
Approximately 1.0%–2.0% |
Approximately 0.40%–0.55% |
Budget-conscious installations with sufficient roof area |
Reliable and widely available, but generally less space-efficient than newer designs |
| N-Type TOPCon Silicon |
21.5%–23.5% |
400–580 W |
Approximately −0.29% to −0.32%/°C |
Approximately 1.0% |
Approximately 0.30%–0.40% |
Most homeowners seeking a strong balance of efficiency, cost, and availability |
Lower temperature losses and reduced light-induced degradation than many older designs |
| Heterojunction Silicon |
21.5%–24.0% |
400–620 W |
Approximately −0.24% to −0.30%/°C |
Approximately 1.0% |
Approximately 0.25%–0.35% |
Hot climates or roofs where high energy yield is especially important |
Strong temperature performance, but installation cost can be higher |
| Back-Contact Silicon |
22.0%–24.5% |
420–660 W |
Approximately −0.29% to −0.35%/°C |
Approximately 1.0% |
Approximately 0.25%–0.35% |
Small or shaded roofs where maximum output per square meter matters |
Very high efficiency and clean appearance; product availability and price vary |
| Bifacial N-Type Module |
Front-side rating typically 21.5%–23.5% |
400–620 W |
Approximately −0.29% to −0.35%/°C |
Approximately 1.0% |
Approximately 0.30%–0.40% |
Ground mounts, elevated roofs, or light-colored surfaces that reflect sunlight |
Rear-side energy gain depends strongly on mounting height, surface reflectivity, and shading |
| Thin-Film Photovoltaic |
Approximately 10%–19% |
Typically lower power per square meter |
Often approximately −0.20% to −0.30%/°C |
Varies by technology and product |
Varies by technology and product |
Large roofs, lightweight structures, or projects with unusual surface requirements |
Better high-temperature behavior in some designs, but more roof area is usually required |
How to read the table: STC means Standard Test Conditions: 1,000 W/m² irradiance, 25°C cell temperature, and an air-mass value of 1.5. Actual household output will vary with roof orientation, tilt, shading, temperature, soiling, inverter losses, and local sunlight.
Figures are representative technology ranges for residential photovoltaic products available or emerging around 2026. Exact specifications, degradation warranties, dimensions, and power ratings differ by manufacturer and model.
Size Battery Storage Around Peak Demand and the 10–15 kWh Home Range
How to Choose Solar Power for Home in 2026?
Choosing solar power in 2026 starts with the battery, not the panel count. Many households use 10–15 kWh of storage, but that range is only a starting point. Your evening loads matter more than total daily consumption. Measure them. Record cooking, water heating, cooling, refrigeration, and electric vehicle charging for at least seven days. Smart meters and circuit monitors can reveal a short, sharp demand spike. That spike may determine inverter size, even when energy use appears modest.
Size usable battery capacity around the loads you want during an outage. If you need six hours of backup, list each appliance and its running watts. Include startup surges from pumps, compressors, and motors. A 12 kWh battery may provide less than 12 kWh after reserve limits and conversion losses. Ask an installer to show the calculation in writing. Also check continuous power, peak power, recharge time, and expected winter production. Capacity alone is not enough.
Local weather and household habits can shift the answer. Cloudy weeks may require a larger reserve, while moderate climates may not. Keep essential circuits separate from flexible loads when designing backup. That choice can reduce battery size without sacrificing refrigeration or essential equipment. Have a qualified professional review electrical compatibility, ventilation, fire safety, and installation requirements. My initial estimate might still be optimistic. Real life is messier. Guests, heat waves, and late-night charging can quickly change peak demand.
Verify Costs, Incentives, Warranties, and the 2026 Payback Period Forecast
Choosing solar power for a home in 2026 requires more than comparing installation prices. Request at least three itemized quotes, including panels, labor, permits, wiring, storage, and future maintenance. Ask how the estimate changes if your roof needs repairs. A low price may hide necessary work. Verify every incentive through current government and utility sources, because eligibility, deadlines, and payment rules can change.
Calculate the payback period using your actual electricity bills, not an average household profile. Include expected energy production, annual rate increases, battery replacement, financing costs, and export payments. A reasonable 2026 forecast may show a payback period of several years, but local sunlight and utility rules can shift it significantly. Forecasts are not promises. Use a conservative and an optimistic scenario.
Warranties deserve careful attention. Check product coverage, performance guarantees, labor terms, exclusions, and the process for making a claim. Some warranties look long but provide limited protection after installation problems. Keep contracts, inspection records, and maintenance reports in one file. An independent electrician or certified energy assessor can review the proposal before you sign. I would not rely on a salesperson’s spreadsheet alone. It can miss roof shade, seasonal demand, or battery losses. My own calculation might still be imperfect, especially when electricity prices change unexpectedly. That uncertainty should appear clearly in your budget.